Audiogram Interpretation
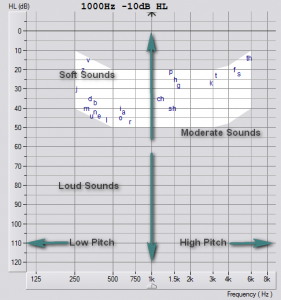
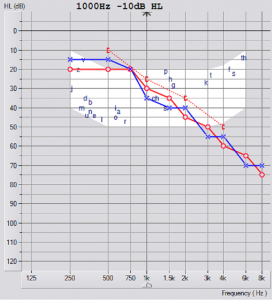
An Audiogram is used to verify the type and severity of a hearing loss and provides information to determine the most appropriate course of action.
Our About Hearing section has a couple of short videos graphically demonstrating how the hearing process works and what happens with a Sensorineural loss.